In a previous article, we looked at some data that we can use to proxy two common asset classes in Hong Kong i.e., Hong Kong Equity and Hong Kong Fixed Income. We also looked at some metrics we can use to measure how well we were doing (or not!)
In this article, let’s have a look at the question of “what’s the right asset allocation”? We will look at the impact of different rebalancing rules in the next article.
Mixing Asset Allocation Portfolio
As a reminder, this article uses the total returns from 2800.HK (the Tracker Fund) to represent Hong Kong Equities, and 2819.HK (the ABF Hong Kong Bond Index Fund) to represent Hong Kong Fixed Income. This does not mean that I endorse either of them or advise you to invest in these ETFs. We use their historical data to learn what has happened in the past.
In this article, we look at different mixes of HK Equity and HK Fixed Income in steps of 5% .
We start with a portfolio of 100% HK Fixed income + 0% HK Equity, then see what happens when we have a portfolio of 95% HK Fixed income + 5% HK Equity, and so on until we get to a portfolio with 0% HK Fixed income + 100% HK Equity.
We then chart the return and uncertainty of these portfolios to see what would have happened if we had invested in these mixes over the 16 years to 30 June 2021.
The following has been calculated assuming we rebalance our portfolios at the end of each month back to their desired mixes
Return vs Uncertainty
If you recall from the last article, the following return and uncertainty figures were calculated from the data.
16-year period to 30 June 2021
Hong Kong Equity
Hong Kong Fixed Income
Average Return p.a.
7.8%
2.5%
Average Uncertainty p.a.
20.1%
3.4%
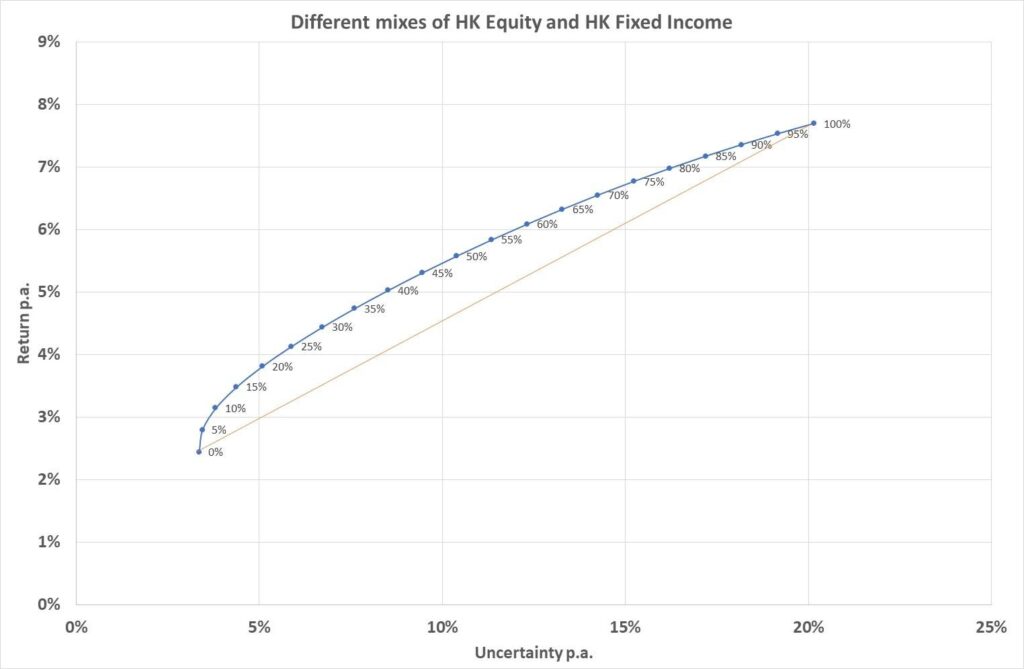
So, we will plot these points on a graph with return on the y-axis and uncertainty on the x-axis, and these are the two end-points on the following chart.
The same measures are plotted for the various mixes (and the HK equity weight is noted next to each point) so you can see the level of return and uncertainty from each portfolio.
The first thing you might notice is that they do not lie on a straight line in between the two endpoints (this is drawn for you in orange). The reason for that is the asset classes are not fully correlated. Sometimes one asset class goes up during the month while the other asset class goes down. Even if they move in the same direction, they do not move with the same size. Because of this, the total uncertainty is reduced from what you might expect because each asset classes’ uncertainty can offset the other. This is a key benefit of diversification.
Diversification is why you may have heard people saying that one should invest in uncorrelated assets. As long as they are not fully correlated (i.e., move in the same direction and by the same amount all the time), diversification can reduce your overall portfolio risk.
The other thing you may notice from the graph is that the more equity you may have had in your portfolio, the higher the return. However, the uncertainty of the return of your portfolio also went up. That is, the chance of a low return increases but so does the chance of a high return but on average it goes up.
How do I choose which one is best?
The answer is – it depends on what you want to achieve.
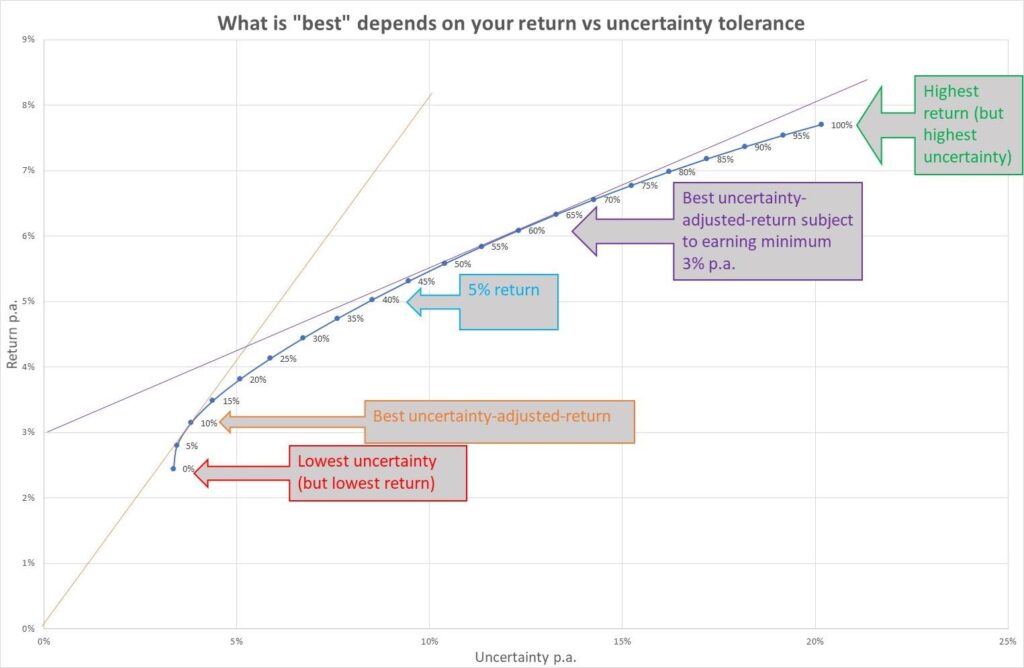
Let us look at a few different ways to choose “the best”. The colors refer to the chart below.
[Red] if you do not like uncertainty, you may choose the first asset allocation with 0% HK Equity and 100% HK Fixed Income. This gives you the most certain outcome but also the lowest one.
[Green] If you just want to maximize your return, you might choose the last asset allocation with 100% HK Equity and 0% HK Fixed Income. This would have given you the highest return on average, but with uncertainty i.e., you might actually get a low (or negative) return or a high return but on average, you should do well.
[orange] You might want to maximize your return per unit of uncertainty. This is the highest sloped line from the origin of the chart (this is the orange-coloured line in the chart below) which just touches the curve representing all the portfolios. In a way, this is the best bang-for-buck – one keeps taking on more uncertainty until it is no longer worthwhile doing so. You can see an asset mix with about 20% HK equity and 80% fixed income might meet your requirements.
[Purple] You might want to maximise your return per unit of uncertainty, but you also want to beat inflation. Note: over the last 16 years, inflation was about 2.7% p.a. but let us round this up to 3% for simplicity. So where the purple-coloured straight line (starting with a return of 3% p.a with zero uncertainty). touches the curve representing all the portfolios would be optimal. Again, one keeps accepting higher levels of uncertainty until it no longer makes sense to do so. The asset mix is about 60% HK equity and 40% fixed income.
[Cyan] You may want a minimum return of (say) 5% p.a. (representing 2% above inflation) and want no more uncertainty after this. This is where a 40% equity + 60% fixed income portfolio (roughly) might suit your needs.
… and so on … (you can make up whatever constraints you like that balance your desired return against your uncertainty and it really depends on your taste or tolerance).
Conclusion: aim to get a return somewhat higher than inflation
I would expect most investors to want a return that is higher than inflation (and transaction costs which I have ignored) so asset mixes of 40% HK equity and 60% fixed income and above may (from history at least) achieve this.
Depending on one’s tolerance to uncertainty, higher levels of HK equity may be accepted. I would emphasize that the future will not reflect the past. Also, you will get a different answer depending on the data and the period of data you use. However, by doing this study, we now have a place to start a discussion on what an asset allocation might look like and how much uncertainty someone might be able to tolerate.
Some judgment comes into play looking ahead. As previously mentioned, the future will not reflect the past and you can adjust this mix depending on your views about the future. Also, you may desire a higher return after inflation and are willing to take on more uncertainty. Again, you may want to adjust the asset mix for your own purposes. Of course, you can also adjust it from time to time (this is called tactical asset allocation) but I hope the article gives you a baseline from where to start.
Personally, I aim for about 70%-80% in growth assets (e.g. equity, real estate) and the rest in defensive assets (e.g. fixed income, cash). This is because I am prepared to tolerate my growth assets halving in very bad circumstances. This may not be suitable for you so please seek professional advice for your particular circumstances.
There are two key points from this article. The first is that mixing assets can help reduce overall uncertainty through diversification. The second is that the asset mix is all about balance. To achieve a certain return, a certain amount of uncertainty would have to be tolerated. If you are unable to tolerate that, you may have to accept a negative real return (after inflation).
In the next article, we will look at a few different rule-based ways of rebalancing the portfolio over time and see if there is something in that.
With over 30 years of work experience across 7 Asia-Pacific countries, Andy is an actuary who has worked primarily in the investment management and life insurance industries including Chief Investment Officer and Responsible Officer roles. He has had the good fortune to have had a broad range of roles that include pricing, retirement savings, modelling, performance analysis, risk management, portfolio management, M&A, hedging, ALM and product development.
Andy graduated from Macquarie University Sydney with a BEc (Hons). He was recently awarded a Distinguished Service Award by the Institute of Actuaries of Australia.
The content of this article is provided by Andy Yang and serves for reference only. It does not represent Bowtie's position. Bowtie assumes no responsibility for any loss or damage incurred by any person as a result of using, misusing, or relying on any information or content herein. Any content related to Bowtie products in this article is for reference and educational purposes only. Customers should refer to the detailed terms and conditions on the relevant product web pages.