Asset Allocation – Learning from Past Asset Class Data
There are some interesting things we can learn from history to improve the way we manage our finances. This article will be the first article of a series based on the same relatively simple and publicly available Hong Kong information, to see what we can learn and perhaps apply in the future.
In this article, let’s have a look for some data for two common asset classes and measures we will be using to compare strategies.
Two asset classes in Hong Kong
Let’s keep it simple and just look at two asset classes – Hong Kong Equities and Hong Kong Fixed Income. To study these, one would normally look for benchmark indices that represent these asset classes. However, there are usually fees to get this information and you may want to replicate the following, so we will proxy these by using two Exchange Traded Funds (ETFs) that are available in Hong Kong.
Hong Kong Equities will be represented by using 2800.HK (the Tracker Fund) which is managed and benchmarked against the Hang Seng Index. However, we will be adding dividends to this so that we get a Total Return Index i.e., we care about both the price increases and dividends over time.
Hong Kong Fixed Income will be represented by using 2819.HK (the ABF Hong Kong Bond Index Fund), which is managed and benchmarked against the Markit iBoxx ABF Hong Kong Total Return Index.
In no way do I advocate, nor do I advise you to invest in these ETFs. I am simply using their historical information to represent the behavior of two fundamental asset classes in Hong Kong. Please study the relevant factsheets on http://www.trahk.com.hk and http://www.assetmanagement.hsbc.com.hk for details and seek professional advice if you are interested in them.
Given all of this, the historical track record of 2800.HK and 2819.HK can be constructed to represent the two asset classes of interest. In the construction of historical information, the additional return from dividends is added to the daily price return on the day they go ex-dividend. In real life, one cannot achieve this return, as it takes time for dividends to be paid out, and it may take more time to get the dividends reinvested. However, the ex-date is the day that prices in the markets adjust for dividends and is consequently, commonly used by index constructors.
The data for both ETFs were collected from 30 June 2005 to 30 June 2021. There are 16 years of monthly returns.
Reminder of Above Data Usage
The results I have may differ slightly from other sources due to rounding errors but should not impact the overall narrative.
Transaction costs and other fees have been ignored in this study, to keep it simple. Results will depend on the amounts you are able to invest as there are some economies of scale for larger amounts. Because of this assumption, please treat the numbers below as over-estimates.
Also, what happened in the past will not be repeated in the future so any outcomes you may get in the future will not be as illustrated below. The idea is to learn what we can from history and then try to apply it.
The measurement of Return and Risk
We will want to know how well we have done with our investments. A common measure of this is what I will term “returns” and by this, I mean the Compound Annual Growth Rate (CAGR).
It is common to use a measure of risk so one can balance how much risk is taken to achieve the return. There are various measures, but a very common proxy for risk is volatility or standard deviation, which is a measure of how spread out the returns can be. This is not a measure of the risk of losing money but of the uncertainty of the returns.
Of course, the greater the uncertainty of an investment, the greater your chance of losing money but also, the greater your chance of making money.
So to be clear about this, I will use the term uncertainty for the rest of this article as a proxy for risk.
Here are some numbers so you can see what happened with our two asset classes over the last 16 years.
16 year period to 30 June 2021
Hong Kong Equity
Hong Kong Fixed Income
Average Return p.a.
7.8%
2.4%
Average Uncertainty p.a.
20.1%
3.4%
Worst and best 1-year return (to show there is some link between uncertainty and the risk of losing money)
-21.9% to 18.4%
-3.5% to 3.5%
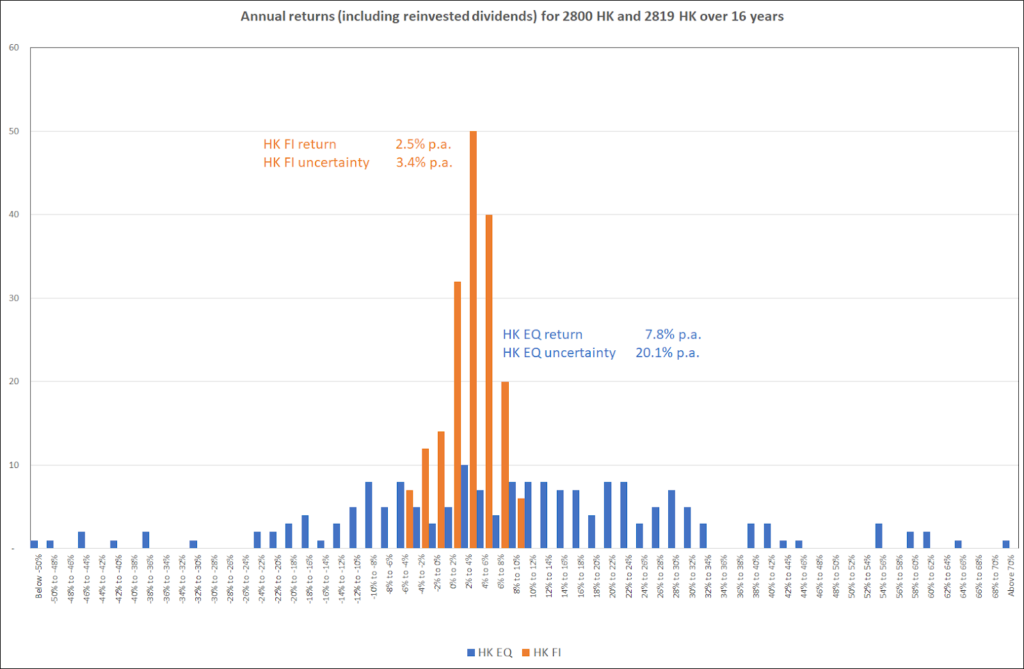
It may help to visualize this by looking at the possible outcome of one-year returns for Hong Kong Equity vs Hong Kong Fixed Income over the 16-year period. As you can see, while the average return for Hong Kong Equity (HK EQ) is higher, the possible outcomes are spread out and there is a chance that you can get returns that are either quite low or quite high. The returns for Hong Kong Fixed Income (HK FI) is more consistently bunched around its (lower) average return.
And so?
Over the last 16 years, the returns of these asset classes are quite different so by using both asset classes, we can get some diversification to reduce uncertainty.
The returns may look a little low, but inflation over the 16 years is about 2.7% p.a. so on average, we would get a real return of -0.2% p.a. for HK Fixed Income and +5.1% p.a. for HK Equity so perhaps it is not as bad as you might think.
You may be wondering:
The uncertainty in Hong Kong Equity is much higher than for Hong Kong Fixed Income. Do I want that risk?
Why would you accept a negative real return after inflation?
Should we mix these two assets?
We will explore these ideas and others in the next few articles. The next article will look at the question of “what’s the right asset allocation” i.e. how much should I place in each of these asset classes?
With over 30 years of work experience across 7 Asia-Pacific countries, Andy is an actuary who has worked primarily in the investment management and life insurance industries including Chief Investment Officer and Responsible Officer roles. He has had the good fortune to have had a broad range of roles that include pricing, retirement savings, modelling, performance analysis, risk management, portfolio management, M&A, hedging, ALM and product development.
Andy graduated from Macquarie University Sydney with a BEc (Hons). He was recently awarded a Distinguished Service Award by the Institute of Actuaries of Australia.
The content of this article is provided by Andy Yang and serves for reference only. It does not represent Bowtie's position. Bowtie assumes no responsibility for any loss or damage incurred by any person as a result of using, misusing, or relying on any information or content herein. Any content related to Bowtie products in this article is for reference and educational purposes only. Customers should refer to the detailed terms and conditions on the relevant product web pages.